Grab The Discount | Flat Rs1000 off for new learners | Code: OFF1000
GT Academy, now revamped as LearninGT.com

What is data visualisation and its importance?
- November 29, 2023
In the realm of business intelligence, data visualisation importance continues to grow as organisations rely on data-driven decision-making. Data visualisation transforms raw data into meaningful insights through charts, graphs, and dashboards, making complex information easier to understand and act upon. The adage "a picture is worth a thousand words" perfectly highlights the value that data visualisation brings to modern businesses.
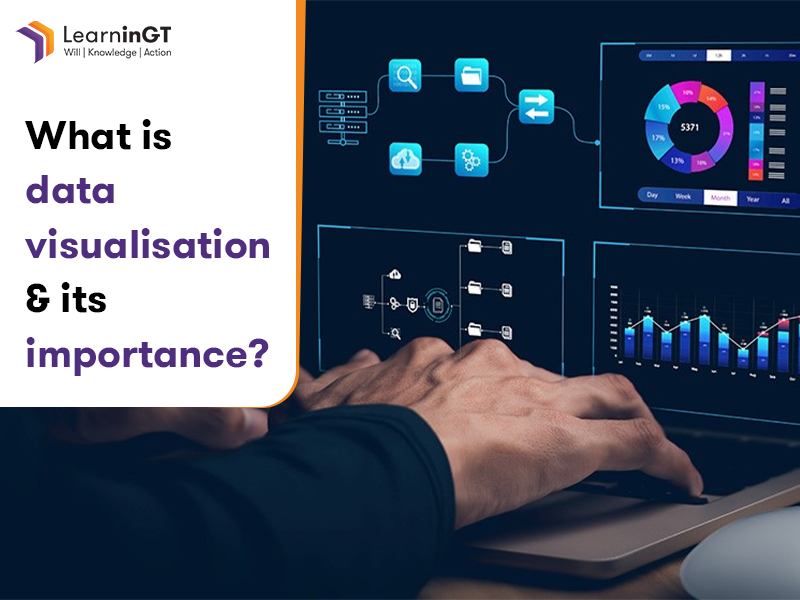
Data visualisation is the skillful presentation of intricate data through visual mediums like charts, graphs, and dashboards, aiming to enhance its accessibility and comprehensibility.
In today's data-driven business environment, organisations generate vast amounts of information every day. However, without proper interpretation, this data can be overwhelming and difficult to use effectively. Therefore, data visualisation plays a crucial role in transforming complex datasets into clear and actionable insights. Moreover, it helps businesses identify trends, patterns, and opportunities that might otherwise go unnoticed. As a result, decision-makers can analyse information more efficiently, communicate findings more effectively, and make informed strategic decisions. Furthermore, engaging visual representations improve data comprehension and retention, enabling teams to collaborate better and respond quickly to changing business needs.
At LearninGT by Grant Thornton Bharat, we recognise data visualisation as a vital element of business intelligence, enabling organisations to make informed decisions for a competitive edge in today's dynamic business landscape. We base our training approach on experiential learning, enabling participants to explore live industry examples, simulations, and hands-on projects. This ensures practical expertise and proficiency with relevant tools.
To know more about our data visualisation certification course, click here.
Data visualisation is the skillful presentation of intricate data through visual mediums like charts, graphs, and dashboards, aiming to enhance its accessibility and comprehensibility.
Why does data visualisation matter?
In today's data-driven business environment, organisations generate vast amounts of information every day. However, without proper interpretation, this data can be overwhelming and difficult to use effectively. Therefore, data visualisation plays a crucial role in transforming complex datasets into clear and actionable insights. Moreover, it helps businesses identify trends, patterns, and opportunities that might otherwise go unnoticed. As a result, decision-makers can analyse information more efficiently, communicate findings more effectively, and make informed strategic decisions. Furthermore, engaging visual representations improve data comprehension and retention, enabling teams to collaborate better and respond quickly to changing business needs.
- Simplifies complex data: In a data-saturated business landscape, organisations grapple with copious amounts of information. Data visualisation eases this complexity by converting raw numbers into clear, concise visuals that narrate a compelling story.
- Facilitates quick decision-making: Contemporary business environments demand prompt decision-making. Visualisation offers a lucid and comprehensive depiction of data, enabling decision-makers to swiftly identify trends and correlations.
- Enhances engagement: Visual content proves to be more engaging than detailed spreadsheets and reports. Individuals are naturally drawn to visuals and are more likely to retain information presented in an aesthetically appealing manner.
- Strengthens communication: Visuals support effective communication across teams, departments, and global organisations, transcending language barriers and ensuring easy comprehension by a diverse audience.
- Forecasts the future: Data visualisation plays a crucial role in forecasting upcoming trends and conducting predictive analysis, especially in areas like demand forecasting, inventory management, and financial planning.
At LearninGT by Grant Thornton Bharat, we recognise data visualisation as a vital element of business intelligence, enabling organisations to make informed decisions for a competitive edge in today's dynamic business landscape. We base our training approach on experiential learning, enabling participants to explore live industry examples, simulations, and hands-on projects. This ensures practical expertise and proficiency with relevant tools.
To know more about our data visualisation certification course, click here.